Developer Guide
Twitter API Toolkit for Google Cloud: Filtered Stream
By Prasanna Selvaraj
Detecting trends from Twitter requires listening to real-time Twitter APIs and processing Tweets on the fly. And while trend detection can be complex work, to categorize trends, Tweet themes and topics must also be identified—another potentially complex endeavor as it involves integrating with NER (Named Entity Recognition) / NLP (Natural Language Processing) services.
The Twitter API Toolkit for Google Cloud: Filtered Stream solves these challenges and supports the developer with a trend detection framework that can be installed on Google Cloud in 60 minutes or less.

Why use the Twitter API toolkit for Google Cloud: Filtered Stream?
Twitter API Toolkit for Google Cloud: Filtered Stream - framework can be used to detect macro and micro-level trends across domains and industry verticals
Designed to horizontally scale and process higher volumes of Tweets in the order of millions of Tweets/day
Automates the data pipeline process to ingest Tweets into Google Cloud
Visualization of trends in an easy-to-use dashboard
How much time will this take? 60 mins is all you need
In 60 minutes, or less, you’ll learn the basics of the Twitter API and Tweet annotations—plus, you’ll gain experience in Google Cloud, Analytics, and the foundations of data science.
What Cloud Services this toolkit will leverage and what are the costs?
- This toolkit requires a Twitter API account; sign-up for free essential/elevated access today to get started. Essential access allows 500K Tweets/month and Elevated access allows 2 million Tweets/month
- This toolkit leverages Google BigQuery, App Engine, and DataStudio. For information on pricing, refer to the Google Cloud pricing
What kind of dashboard can you build with the toolkit?
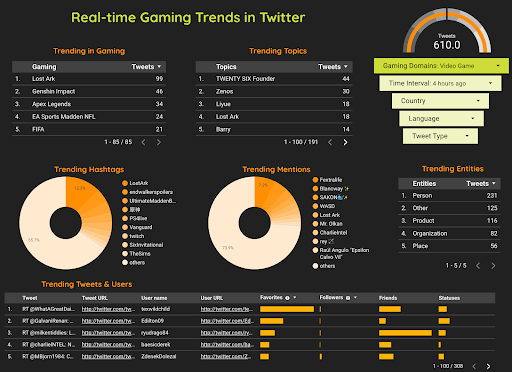
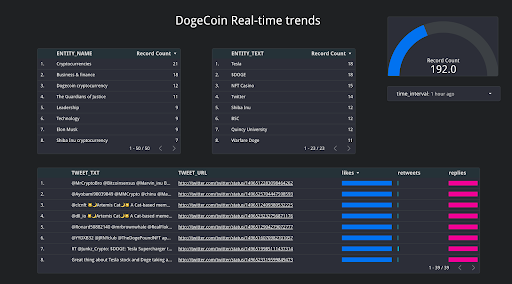
- Below are a few real-time dashboard illustrations that are built with the Filtered Stream toolkit.
Fig 1, depicts a real-time ‘Gaming’ dashboard that depicts the conversations on Video games on Twitter. You can get insights on the trending topics in Gaming, popular hashtags, and the underlying Tweets that are streamed in real-time.
Similarly, Fig 2 depicts the real-time analysis of the ‘DogeCoing Cryptocurrency’
This toolkit helps you to build a real-time trend detection dashboard
Monitor real-time trends for configured rules as they unfold on the platform
The dashboards below is an example built with the toolkit that illustrates real-time trends in gaming
Give me the big picture

This toolkit is comprised of 5 core components that are responsible for listening to real-time Tweets, pushing Tweets to a topic/queue, a CRON job that triggers a Tweet loader service which pulls the Tweets from the topic/queue to store them in a database, and, finally, Tweet visualization in a dashboard that connects to the database via a SQL query.
Tweet streamer service (nodeJs component)
The Tweet streamer service is responsible for listening to the real-time Twitter Filtered Stream API and pushes the Tweets temporarily to a Topic that is based on Google PubSub. The Filtered Stream rules are governed by the Filtered Stream Rules API.
Stream topic based on Google PubSub
The stream topic based on Google PubSub acts as a shock absorber for this architecture. When there is a sudden surge of Tweets, the toolkit can handle the increased volume of Tweets with the help of PubSub. The PubSub topic will act as temporary storage for the Tweets and batch them for the Tweet loader service to store the Tweets in the database. Also, this will act as a shield to protect the database from a huge number of ingesting calls to persist the Tweets.
CRON job based on Google Cloud Scheduler
A CRON job based on Google Cloud Scheduler will act as a poller that will trigger the Tweet loader service at regular intervals.
Tweet loader service (nodeJs component)
The Tweet loader service that gets triggered based on the CRON job will pull the Tweets in a batch mode (i.e. 25 Tweets per pull, configurable via config.js file), and store the Tweets in a BigQuery database.
Google DataStudio as a Dashboard for analytics
Google DataStudio is the dashboard for trend detection and connects to the BigQuery via a SQL query with a time interval as a parameter. Trends can be analyzed based on the time interval which can range from minutes to hours. For example, you can analyze trends “60 minutes ago”, passing the time interval variable to the SQL query.
As a user of this toolkit, you need to perform four steps:
Add rules to the stream with the Filtered Stream rules API endpoint
Install and involve the toolkit from GitHub in your Google Cloud project
Configure the CRON job - Google Cloud Scheduler
Configure the dashboard, by connecting to the BigQuery database with DataStudio
Prerequisites: As a developer, what do I need to run this toolkit?
Twitter Developer account! Sign up here
Get a Twitter API bearer token. Refer to this doc
A Google Cloud Account. Sign up here
How should I use this toolkit? - Tutorial
Step One: Add rules to the stream
Add rules to the stream. Let’s listen to Tweets related to “DogeCoin”, however, we only want to listen to 10% of random Tweets of “DogeCoin”. This can be accomplished by
curl -X POST 'https://api.x.com/2/tweets/search/stream/rules' -H "Content-type: application/json" -H "Authorization: Bearer <<YOUR_BEARER_TOKEN>>" -d '{ "add": [ { "value" : "(doge) sample:10"}] }'
2. Validate the rules
curl https://api.x.com/2/tweets/search/stream/rules -H "Content-type: application/json" -H "Authorization: Bearer <<YOUR_BEARER_TOKEN>>"
3. You should get an output like the below if there are no rules previously added. If you have previously added rules, they will also be returned here; ensure you delete them.
      {"data":
[{
"id":"1494395695620575239",
"Value":"doge"}],
"meta":{"sent":"2022-02-17T19:46:16.150Z",
"Result_count":1
}}
Step Two: Install and configure the toolkit (Tweet Streamer and Loader service)
Access the Google Cloud console and launch the “Cloud Shell”. Ensure you are on the right Google Cloud Project
- Set the Google Project ID and enable BigQuery API by running the following commands:
      gcloud config set project <<PROJECT_ID>>
gcloud services enable bigquery.googleapis.com
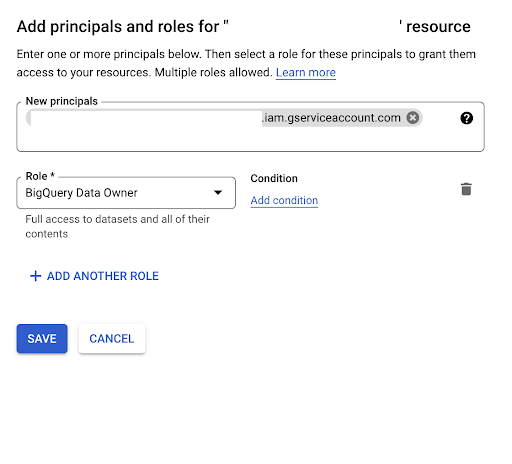
4. Ensure you have access to the BigQuery data owner role. Navigate to Google Cloud Console -> Choose IAM under the main menu -> Add a new IAM permission
Principal: Your Google account email address
Role: BigQuery Data Owner
5. From the “Cloud shell terminal” command prompt, download the code for the toolkit be executing the command:
git clone https://github.com/twitterdev/gcloud-toolkit-filtered-stream.git
6. Navigate to the source code folder
cd gcloud-toolkit-filtered-stream
7. Make changes to the configuration file. Use your favorite editor like vi or emacs
Once you’ve made the following changes, save them and quit the editor mode.
      vi config.js

Edit line #5 in config.js by inserting the Twitter API bearer token (ensure the word ‘Bearer’ must be prepended before the token with a space

Edit line#19 in config.js by inserting the Google Cloud project id
8. Back in the cloud shell, deploy the code in AppEngine by executing the below command: Note that the deployment can take a few minutes.
      gcloud app deploy
 Authorize the command
	If prompted:
 Choose a region for deployment like (18 for USEast1)
 Accept the default config with Y
9. After the deployment, get the URL endpoint for the deployed application with the command:
      gcloud app browse -s default

# 	The above command will output an app endpoint URL similar to this one:

https://trend-detection-dot.uc.r.appspot.com/
10. Use the endpoint URL from the output of step 8) and make a CURL or browser request with “/stream” appended to the request path. This will invoke the toolkit and it starts listening to the Tweets as defined by the rules in the “stream/rules” endpoint
curl https://<<APP_ENDPOINT_URL>>/stream
11. Start tailing the log file for the deployment application
gcloud app logs tail -s default
12. If you don’t see the messages in the logs console as “Received Tweet” or “~~ Heartbeat Payload ~~”, the stream may be disconnected. To reconnect to the stream, make a curl/browser request as below:
curl https://<<APP_ENDPOINT_URL>>/stream
Step Three: Configure the CRON job - Google Cloud Scheduler
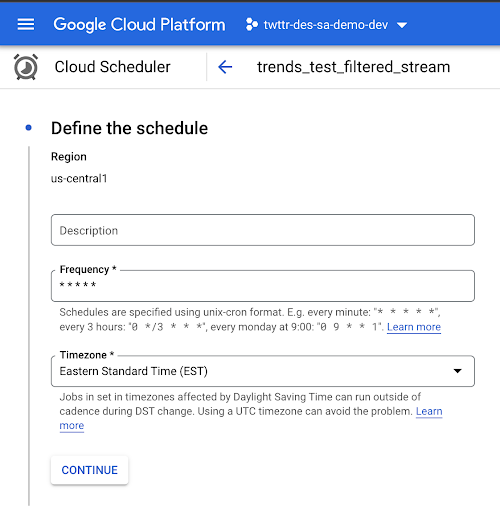
Create a Google Cloud Scheduler Job by navigating to the Google Cloud console and clicking the Cloud Scheduler option under the main menu.
Create a new Cloud Scheduler job and define the schedule with frequency as below: Ensure a space between each asterisk like “* * * * *”
This will ensure that the Cloud Scheduler job triggers every minute.
* * * * *
3. Configure the execution with “Target Type” as “HTTP” and insert your application endpoint URL as below:
https://<<YOUR_APP_ENDPOINT_URL>>/stream/poll/2/30000
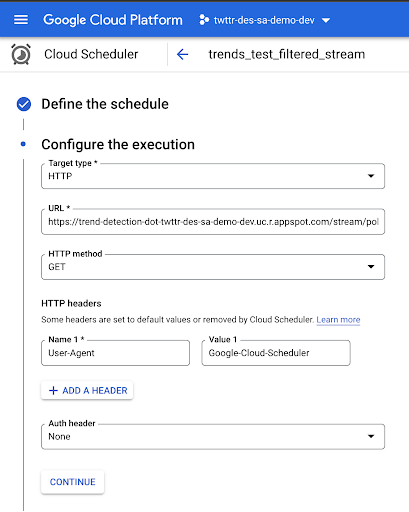
The request “/stream/poll” points to the “Tweet loader” service. Parameters 2 and 30000 refer to the invocation frequency of the Tweet loader service and the time interval in milliseconds. For example “2/30000” will invoke the “Tweet loader” service 2 times within a minute with a delay of 30000 milliseconds or 30 seconds. If you anticipate more Tweets for a topic, increase the invocation frequency and decrease the delay to increase the consumption. This is a calibration that can be fine-tuned based on monitoring of a specific topic like “Crypto” or “Doge coin”
Step four: Configure the Trends dashboard with Google DataStudio
SQL query to be used for Trend detection in DataStudio
Replace your <<datasetId.table_name>> in the below SQL. It should look something like “sixth-hawk.tweets”
      SELECT
  context.entity.name AS ENTITY_NAME, context.domain.name AS DOMAIN_NAME, context.domain.id AS C_ID, entity.normalized_text as ENTITY_TEXT, entity.type as ENTITY_TYPE,
  COUNT(*) AS MENTIONS, TRENDS.text as TWEET_TXT, TRENDS.tweet_url as TWEET_URL, TRENDS.public_metrics.like_count as likes, TRENDS.public_metrics.quote_count as quotes, TRENDS.public_metrics.reply_count as replies, TRENDS.public_metrics.retweet_count as retweets
FROM
  `<<datasetId.table_name>>` AS TRENDS,
  UNNEST(context_annotations) AS context,
  UNNEST(entities.annotations) AS entity
where created_at > DATETIME_SUB(current_datetime(), INTERVAL @time_interval MINUTE)
GROUP BY
  ENTITY_NAME, DOMAIN_NAME, ENTITY_TEXT, ENTITY_TYPE, C_ID, TWEET_TXT, TWEET_URL, likes, quotes, replies, retweets
ORDER BY
  MENTIONS DESC
Step Five: Twitter Compliance
It is crucial that any developer who stores Twitter content offline ensures the data reflects user intent and the current state of content on Twitter. For example, when someone on Twitter deletes a Tweet or their account, protects their Tweets, or scrubs the geoinformation from their Tweets, it is critical for both Twitter and our developers to honor that person’s expectations and intent. The batch compliance endpoints provide developers an easy tool to help maintain Twitter data in compliance with the Twitter Developer Agreement and Policy.
Optional - Delete the Google cloud project to avoid any overage costs
gcloud projects delete <<PROJECT_ID>>
Troubleshooting
Use this forum for support, issues, and questions.
