Exploring #ExtremeWeather: Jakarta Floods

What happened?
In January 2020, a record-breaking rainfall inundated Jakarta, Indonesia with more water than its infrastructure could handle. Severe flooding affected large parts of the capital city, injuring dozens and displacing thousands. As the water rose and blocked roads, shut down one of the city’s airports, and cut off electricity, millions of residents continued to search for and share up-to-date information through X. In the first week of January 2020, there were over 20,000 posts made in Jakarta about the floods.
Let’s take a closer look at what was happening as the conversation unfolded, using insights from a real-time disaster information sharing system developed by Peta Bencana.
Looking at the Flooding in Jakarta
To explore this artwork, hover over this image and scroll through with your mouse. Or, click on the buttons at the bottom of the image, which lets you use your keyboard’s tab key to navigate. This is best viewed on a computer.
Digging deeper into what happened

Jakarta’s unique location in a floodplain with many areas under sea level, and with seven river deltas, already made it highly susceptible to floods. So as the city began to see record-breaking rainfall, activists and organizers at Peta Bencana knew their platform would be invaluable for a real-time picture of which parts of Jakarta were being impacted first, or the most.
“The reason the project works so well is because it responds to existing behaviors,” said Nashin Mahtani, director of the nonprofit Peta Bencana, which provides a free, transparent platform for emergency response and disaster management in South and Southeast Asia. “People were already posting about flooding at an incredible frequency. The challenge was how to collect and structure this data in a safe, anonymous, and useful manner in order to leverage an already available wealth of data as a critical dimension of disaster management infrastructure.”
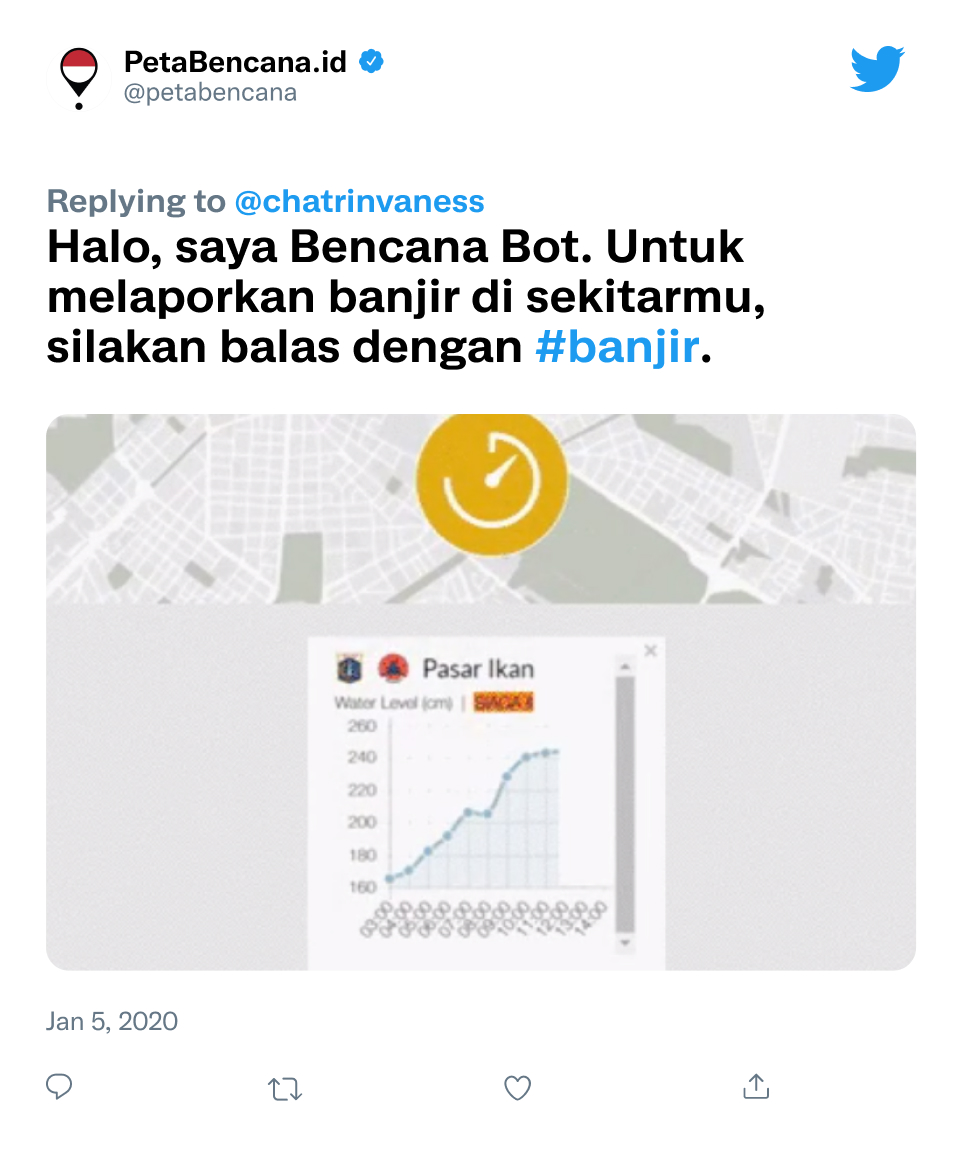
To quickly crowdsource public posts about what was happening, Peta Bencana developed a X “humanitarian bot” using an open source software called CogniCity. This bot listens for posts to the @PetaBencana account with flood and disaster related keywords (such as “banjir”, flood in Bahasa Indonesia) from the people across Indonesia, and automatically responds with a post with instructions on how to share observations.

The auto-reply asks people to confirm incidents of flooding by submitting a simple four-step micro-survey that reports flooding severity, infrastructure failures, and response efforts. This direct engagement with residents enables Peta Bencana to filter through millions of posts and collect confirmed, structured reports directly from the users at street level, removing the need for expensive and time consuming data processing. The framework for gathering data helps Peta Bencana create a real-time map with flood levels and risks, which is immediately made available for free by users and first responders.

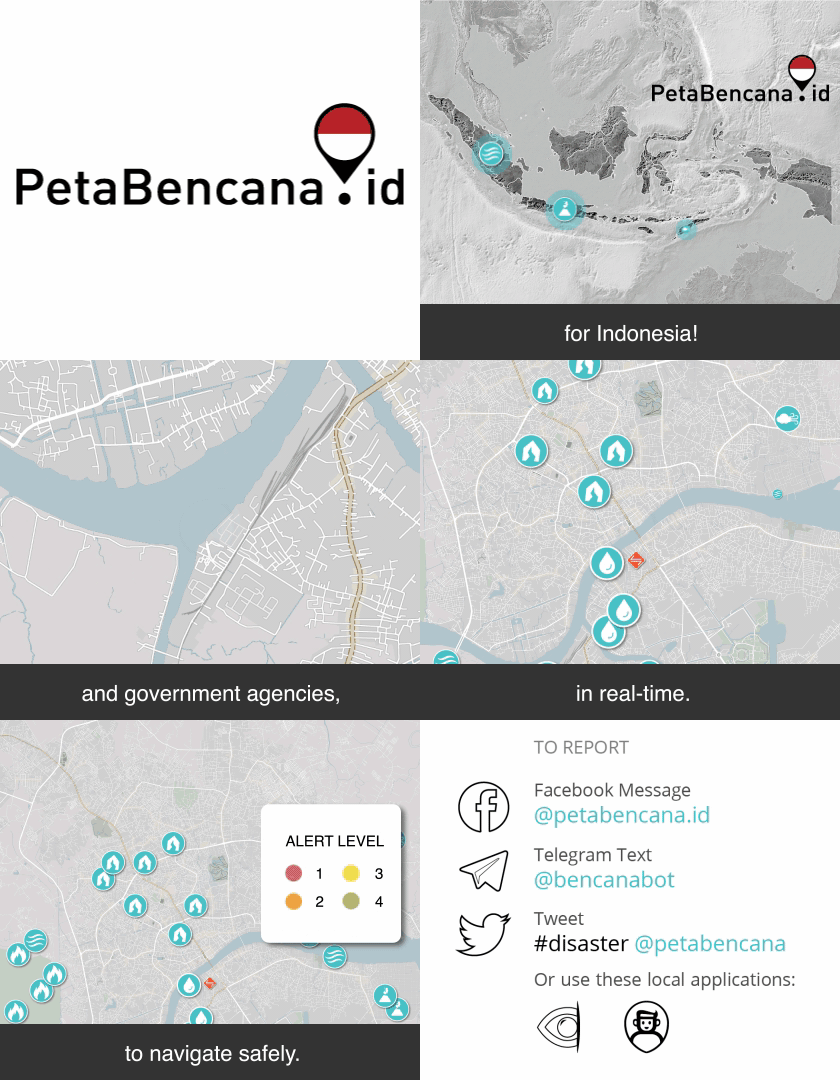
The flood map provided by Peta Bencana was accessed over 259,000 times during the peak of the flooding, a 24,000% increase in activity within a week. Residents checked the map to understand the flooding situation, avoid flooded areas, and make decisions about safety and response.
The Jakarta Emergency Management Agency (BPBD DKI Jakarta) also monitored the map to address resident needs, and coordinate their rescue response based on reported severity and need. As waters receded or support arrived, they kept it up to date with information about flood-affected neighborhoods.

Looking to the future

X is a powerful way to communicate during a natural disaster to get critical information and support, though it also can help us understand how to better prepare for the future. Home to about 60% of the world’s population, the Asia Pacific region is also one of the most vulnerable to the extreme weather impacts of climate change (CNN, 2019).
“Indonesia and the Philippines have quite a lot in common in the context of disaster management… Both countries have a very high hazard vulnerability, but perhaps because of this, both have a strong underlying cultural spirit of mutual aid (gotong royong in Indonesia, and bayanihan in the Philippines). Both countries also have a very high social media usage rate."
To help address this, Peta Bencana intends to expand their efforts across South and Southeast Asia. A pilot of the PetaBencana.id platform launched in the Philippines in September 2020, ahead of five consecutive typhoons that struck the area in October and November. Having proven the validity of community-led information sharing in disaster risk reduction early in during the pilot project, Mahanti and her teams are now working on expanding their platform to support the full country before the upcoming typhoon season. To further support this work, Peta Bencana works through a #DataForGood partnership with the X Developer Platform that launched in early 2021.
Peta Bencana started in 2013, as a joint research project between University of Wollongong and BPBD DKI Jakarta. Now it has evolved into a full platform that leverages open source technologies and the X API to support local humanitarian response efforts. See how you can get involved.

Explore other #ExtremeWeather events

#TexasFreeze

#TyphoonHagibis

#AustraliaFires
#ExtremeWeather
Behind the work
Data insights provided by Peta Bencana
PetaBencana.id is a platform run by Yayasan Peta Bencana as a free, transparent platform for emergency response and disaster management for cities in South and Southeast Asia. PetaBencana.id is part of the USAID CogniCity Open Source Software for Next Generation Community Engagement in Disaster Risk Management Program, and has recently expanded to the Philippines. Each piece is powered by significant contributions from Brandwatch, NTT Data, Sprout Social, and Peta Bencana.
Artwork provided by Design I/O
2020 National Design Award winner for Digital Design, Design I/O is a creative studio specializing in the design and development of cutting-edge, immersive, interactive installations, experimental data visualizations and new forms of storytelling. To learn more, head to Design I/O.

