Industry and Team News
Visualizing the global #ExtremeWeather conversation on Twitter
By Amy Udelson and Nathalia 23 September 2021
By Amy Udelson and Nathalia
23 September 2021

Climate change has contributed to #ExtremeWeather around the world, fueling an increased number of phenomena like floods, wildfires, and typhoons. A recent report from the Intergovernmental Panel on Climate Change (IPCC), the United Nations’ climate science research group, concluded that human-induced climate change is already affecting many weather and climate extremes across the globe -- including increases in frequency and intensity of hot extremes, marine heatwaves, and heavy precipitation.
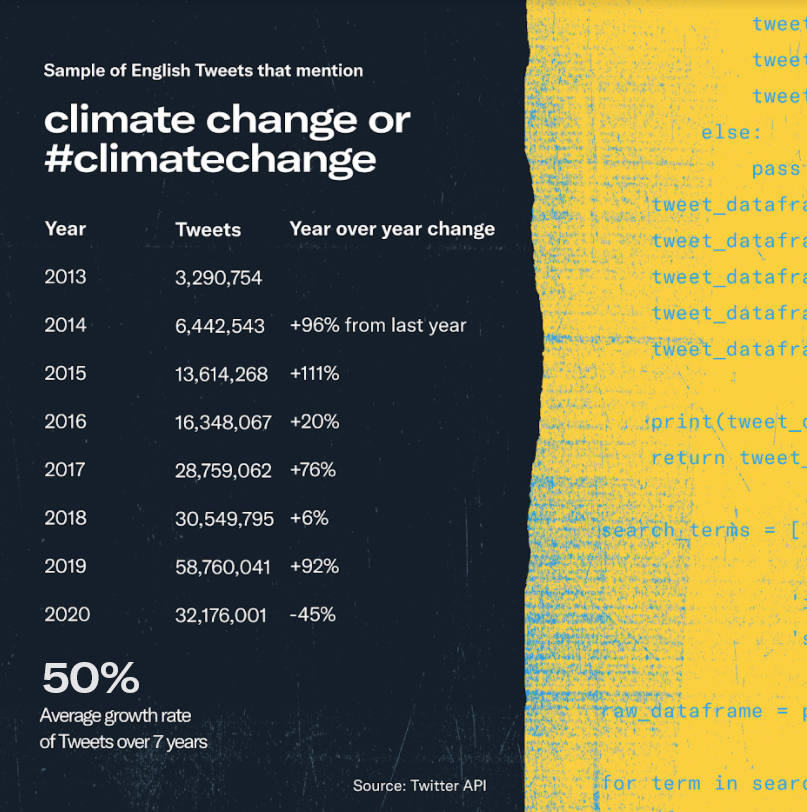
As extreme weather unfolds, people come to Twitter before, during, and after these events to talk about what’s happening. In fact, in a sample of English-language Tweets from 2013 to 2020, mentions of “climate change” grew an average of 50% over the 7 year period measured. This conversation has proven to be powerful and influential, as environmental activists use Twitter to raise awareness about the climate crisis, organize their communities, and connect with others passionate about protecting the planet.

Bringing the #ExtremeWeather conversation to life
By leveraging insights from the public conversation using our API, developers are able to build solutions that help local communities during #ExtremeWeather events or study public sentiment without human bias.
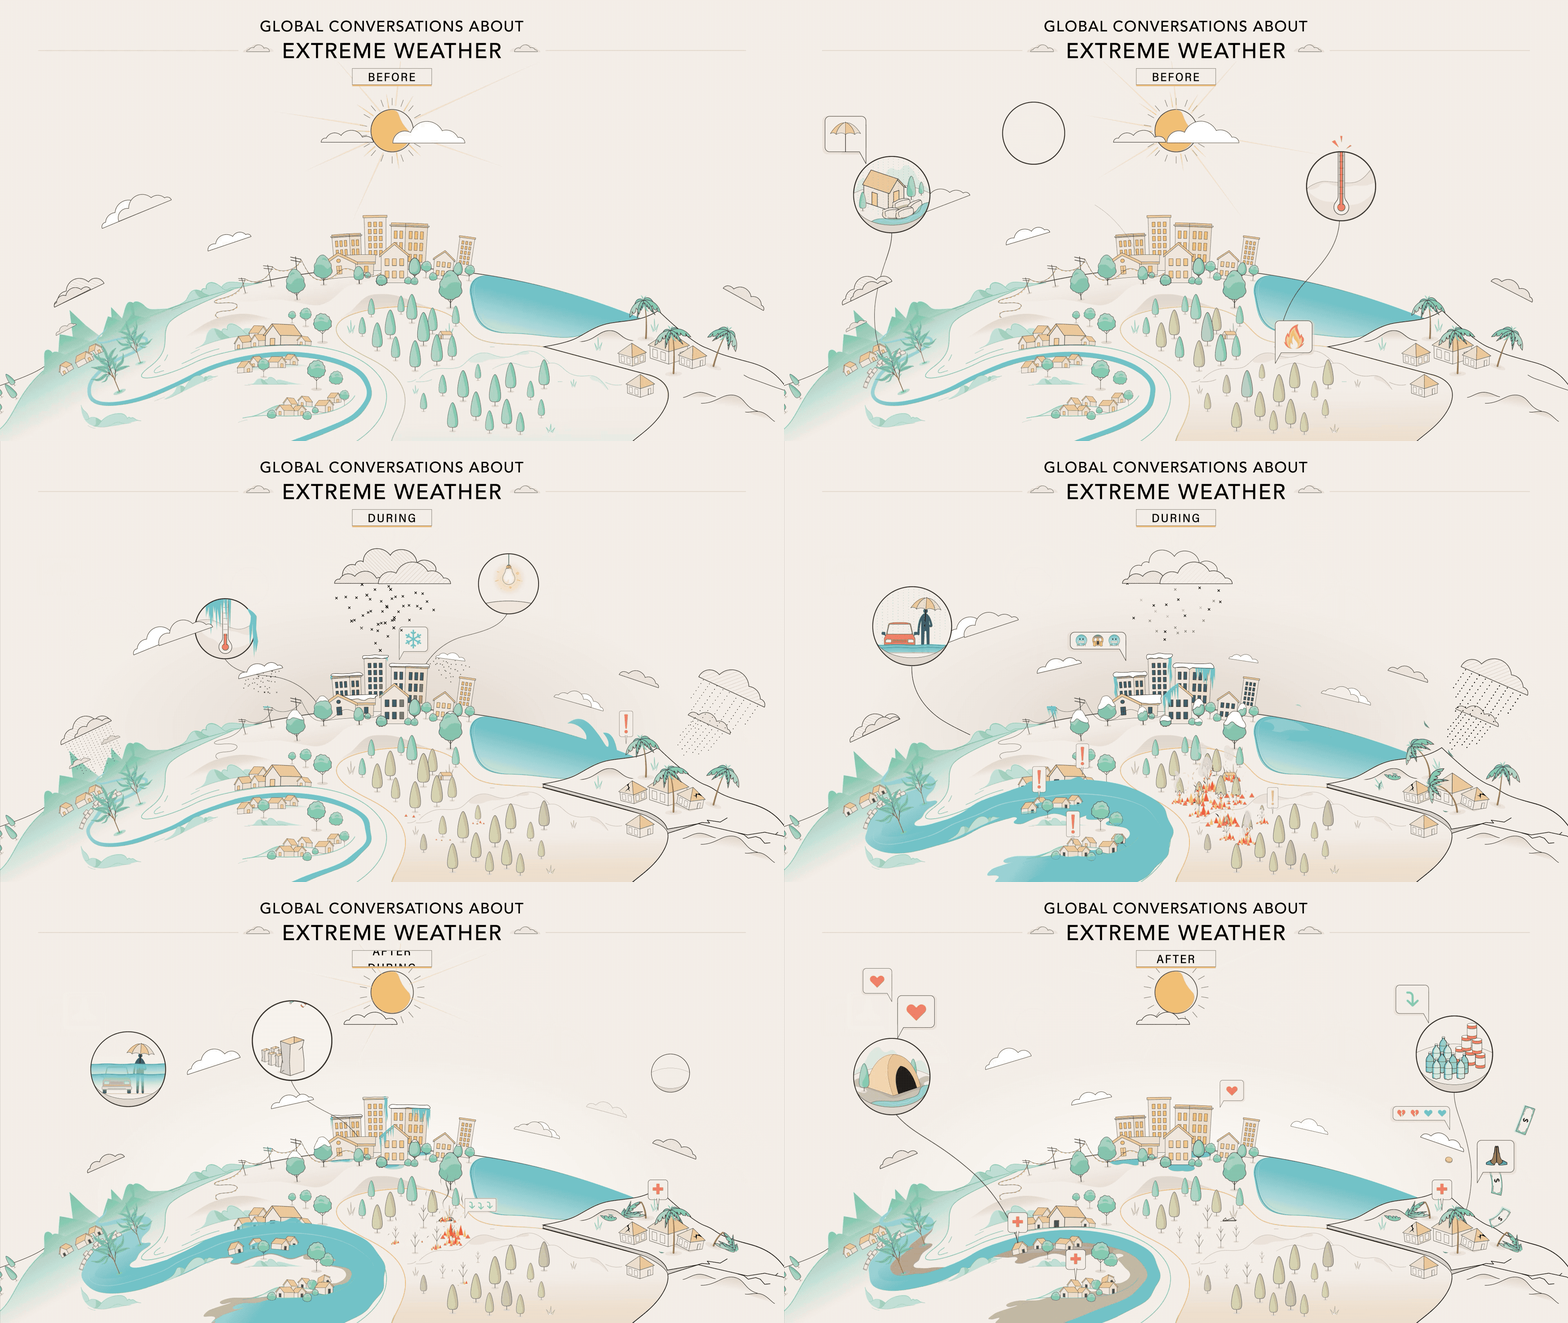
In collaboration with our Twitter Official Partners (Brandwatch, NTT Data, and Sprout Social), Peta Bencana, and creative studio Design I/O, we created an interactive data visualization webpage to explore how conversations evolve on Twitter before, during, and after #ExtremeWeather events across the globe, including the:
- #AustraliaBushfires: From June 2019 to March 2020, the fires in Australia burned 13.6 million acres in New South Wales, devastating the wildlife and ecology of the region (NYT, 2020). Between December 2019 and March 2020, there were nearly 10M public Tweets related to the Australia Bushfires (Source).
- Jakarta Floods: In January 2020, a record-breaking rainfall inundated Jakarta, Indonesia with more water than its infrastructure could handle. Severe flooding affected large parts of the capital city, injuring dozens and displacing thousands. In the first week of January 2020, there were over 20,000 Tweets in Jakarta about the floods (Source).
- #TexasFreeze: The Texas Freeze, also known as the Texas power crisis, lasted for a two week and three day period from February 10 to 27th, 2021 when three winter storms, including a polar vortex, caused a massive electrical failure in Texas due to rare freezing temperatures. On February 18th, conversation about the #TexasFreeze peaked at 50,000 Tweets per day (Source).
- #TyphoonHagibis: In 2019, Northern Japan was hit by the devastating Typhoon Hagibis, which generated three feet of rain in 24 hours in some regions, flash floods, and 74 lives lost (NHK, 2019).

Responding to #ExtremeWeather through developer innovation
These #ExtremeWeather visualizations illustrate how climate change transcends all borders and highlight the importance of global collective action. We believe the developer community can play a key role in shaping how we prepare and respond to these #ExtremeWeather events by using our API in innovative ways, like building tools and dashboards that help people understand what’s happening.
“Developers consistently inspire us with the ways they support people in crisis during natural disasters. The #ExtremeWeather visualization showcases what can be achieved when our developer and partner communities leverage the Twitter API and apply these insights to the public good. We hope this work sparks conversation, increases awareness and creates a connection between those passionate about climate change and disaster relief.”- Amy Udelson, Head of Marketing for the Twitter Developer Platform.
A global crisis will take global action. Are you a developer, researcher, or business working to bring attention to or build solutions that help address the climate crisis? Explore our #ExtremeWeather visualization, tell us what you think at @TwitterDev, or discuss what you’re doing on our developer forums.